Writing narratives with data: An introduction to ggplot2
I wrote this tutorial and presented it at R Ladies Twin Cities. It uses fivethirtyeight biopics data and begins by recreating their graphics. Feel free to use it and share it!
The tutorial is available here! I’m really excited about this topic so I’m excited to share this document with everyone.
My style for teaching data viz is to start by recreating existing plots. For this activity I walk you through recreating the plots from a FiveThirtyEight article about representation in biopics. The last part of the activity gives some prompts for other vizzes!
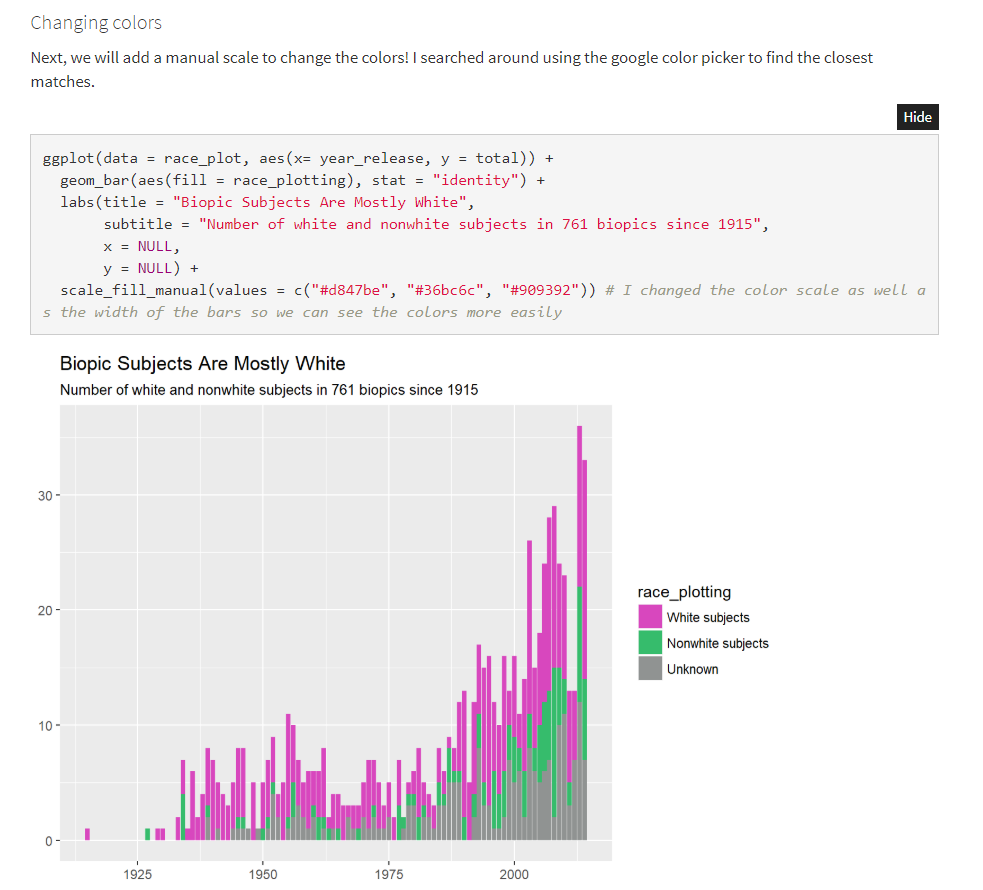
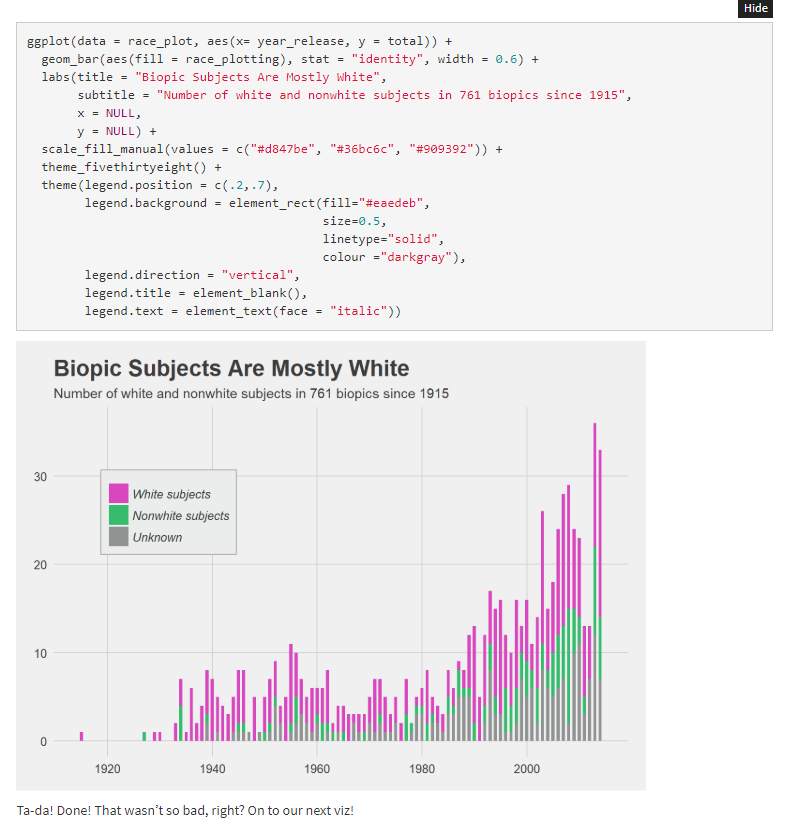
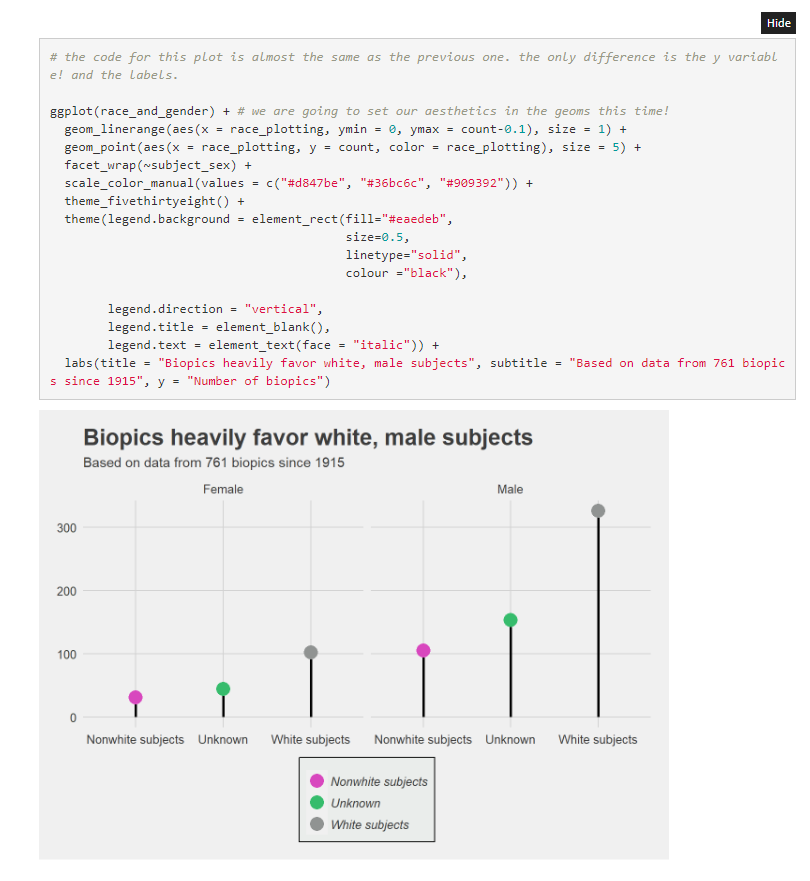
Some screenshots from the activity are below: